Next: The variable window Up: Implementation Previous: Overall structure Contents
The function window displays functions and the call dependencies between them. Because a program may have many functions, it is necessary to be able to display only a subset of the entire program at once. The strategy I adopted was to allow functions to be arranged into a hierarchy of ``groups''. These groups are an entirely new and independent construct in the program, and are arbitrarily created by the original programmer. This means that the programmer can use them to represent any relationship desired, such as high interdependence, use of common data structures, or functional similarity. Any group can contain any number of functions and any number of other groups.
A group is displayed as a window containing icons, representing the contents of that group. Icons that represent groups may be expanded into a new window. Within each window, icons can be rearranged in any pattern that suits the user. This is the most important improvement my program offers over previous systems. It offers the opportunity to organise the program in the following ways:
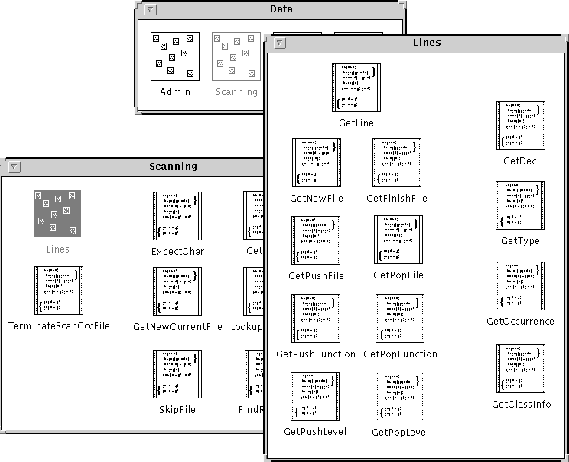
Some examples of function groups are shown in Figure 4.3. They are taken from the representation of the navigator inside itself. The ``Lines'' function group shows the functions that read in lines of output from g++. The icon at the top is for the function GetLine. This is the generic function that controls all the others, and it is placed at the top so that it is the first one seen by the user. The other functions are divided into two areas. The first area contains functions that construct the hierarchical tree structure by pushing into new nodes and popping out of them. The pushing and popping functions are aligned in vertical columns, and they are arranged in rows according to what logical entity they operate on. The result is a two-dimensional grid that would be impossible to show in a normal text file. The second group shows a column of functions that read in the leaves of the tree--declarations, types and so on. The result is a clear indication of what it is that these functions do, and even before the user sees the code they know the names of many of the functions they can expect to see.
Note that this is only way to arrange the icons in a logical way. For example, I could have arranged them according to the data structures they operate on. However, the structure I actually used is more reflective of the way I think about the program, and the way I designed it. This should help future programmers to gain a clearer insight into my intentions, and help them maintain the program more efficiently.
When a program is first read in by the navigator, it has to provide some organisation itself, otherwise the user would be confronted by a bewildering array of functions, all in the same group. As an initial setup, each file is represented by its own group. Within a file's group, included files are represented by sub-groups. A distinction is made between system include files and user include files, because users are rarely interested in the system include files. They are placed in a separate group on their own. However, it may still be useful for the programmer to find out in which file a particular variable or function is declared, so it is important that the user can access the system include files if need be.
Within each group, only the functions that are actually defined are displayed. External declarations are resolved to their non-external definitions. This provides a significant break with more traditional systems in which each file is syntactically independent from the others, in that a function can be declared and used even if it does not actually exist. In the navigator, the files are presented as being part of a whole, and I believe that this corresponds much more closely with a programmer's expectations about the way a program behaves.
Each node, and the windows themselves, have associated menus that can be raised by clicking the right mouse button over them. These provide access to the operations that can be carried out on them, such as allowing groups to be iconified and expanded, and their names to be changed. The colour of any node can be changed to any of seven colours.
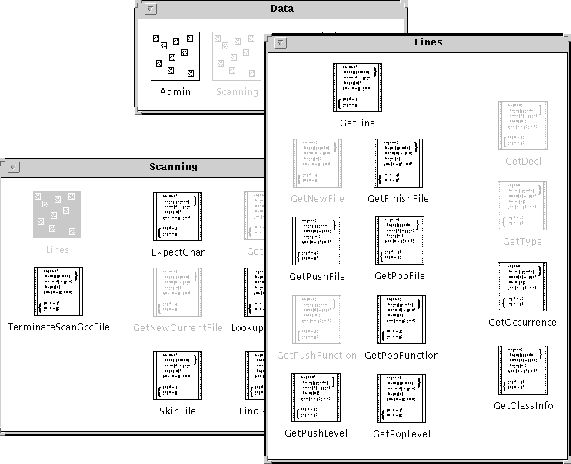
The navigator also provides the ability to show the dependencies between functions. From the menu for a function, the user can choose a colour and have the dependent groups and function coloured in that colour (see Figure 4.4). The navigator colours all functions that call the function, and recursively colours all groups in which they are contained. The user only sees the results of this operation in the windows that are displayed on the screen, so the operation is ``fitted'' to the user's view. However, this doesn't mean that the user misses some of the results of the operation, because of the way groups are coloured. If the function itself is not currently displayed, there is at least the certainty that one of the groups it is contained in will be highlight. The user can then search down from that point, simply expanding each highlighted icon.
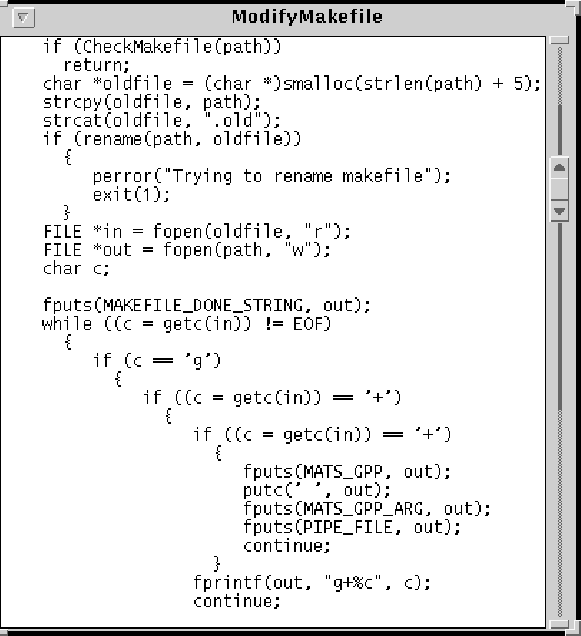
One of the options in the menu for a function node is to view the code of the function. This creates a new window which contains only the text of the function, extracted from the original source file (see Figure 4.5). The function is disentangled from the rest of the code, and by viewing the source to multiple functions, the user can simply and efficiently see code for as many functions as desired side by side, without needing to read in an entire file, and without having to search through a file for the section required.
Matthew Exon 2004-05-28