Next: Expression of a Program Up: Using graphics to help Previous: Using graphics to help Contents
Roberts et al. [16] have used the idea of graphical representation of program structure to help in their introductory computing courses. Through their teaching they discovered that by teaching beginners to express their design of a program in a formal, pictorial manner, they could improve the quality of the code their students produced. Students tended to keep the overall design goals in mind to a greater extent, choose more appropriate control structures such as for and while loops, and declare variables with a more appropriate scope. However, the pictorial design was always done on paper, which meant that implementation still had to be carried out in the traditional textual manner on the actual computer. This resulted in much of the benefit of the pictorial representations being lost. Therefore, they decided to implement the pictorial design process on the computer, and have the computer compile the program directly from the pictorial representation.
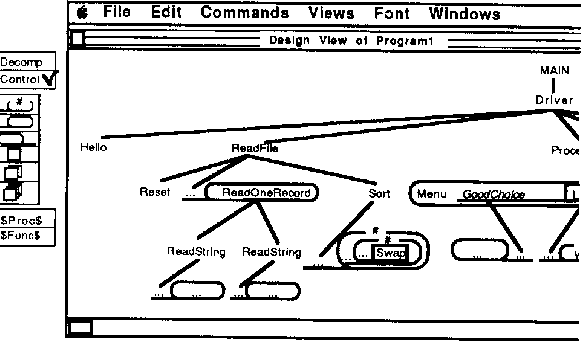
The pictorial design process follows three main steps. Firstly, the student designs the hierarchy of procedure calls that will decompose the program into trivial subtasks. The hierarchy of functions is represented as a tree diagram. Precisely when and under what circumstances the procedures will be called is ignored for the moment. Only when all the procedures that are going to be used are defined can the student move onto the next stage. In this stage, the student decides what control structures will be used to control program flow. The different loops and conditional statements each have a different symbol, and these are added into the tree diagram (see Figure 2.2). Finally, the student allocates variables to the control structures and implements the lowest level procedures in a normal textual way. The intention is that if students are forced to express their ideas in this formal, graphical way, then they will gain a better perception of what the program they've designed will actually do, and perhaps allow them to better understand different approaches.
Matthew Exon 2004-05-28