Next: Gaining an Overall View Up: Environments for expert users Previous: Programming with visual objects Contents
When designing a complicated software system, programmers often spend a considerable amount of time working out ideas in diagrammatic form before moving to the computer. Ikemoto et al. [6] suggested formalising this design process on a computer to ease the construction of a program specification and to improve the verification of a system design. They constructed a number of software tools to fulfill this purpose.
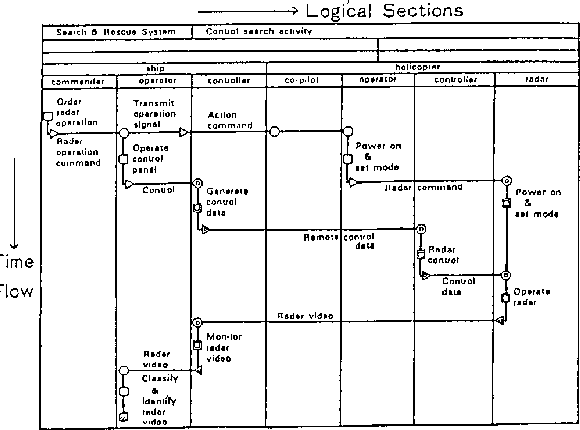
The first of these is an editor to construct an ``SSD Diagram''. The diagram is a two dimensional graph: the horizontal axis is divided into regions that represent different subsystems, while the vertical axis (roughly) represents the flow of time (see Figure 2.5). Functional boxes are arranged at different places on the graph, with arrows to represent the flow of control between the functions of the various subsystems. Thus the overall structure of the system is presented visually.
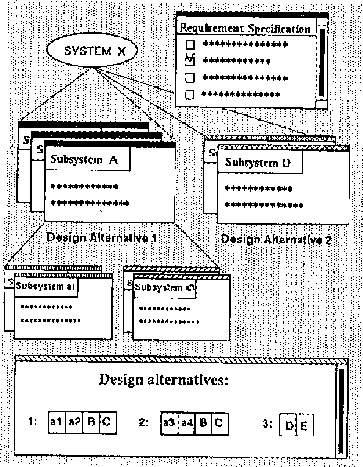
The next stage is to write the specifications for the subsystems. It is necessary here to be able to specify several possible alternatives for the design of each subsystem, and for each subsystem to be further subdivided into subtasks. Thus a tree representation is used. Each node represents a possible design alternative, and is depicted as a stack of cards (each card representing a subsystem required to implement the design alternative). Each card contains the name of the subsystem, and a list of specifications for the functionality of the subsystem (see Figure 2.6). These specifications are automatically used to create a new stack of blank cards one step down the hierarchy. Thus the process of top-down refinement can be carried out in a visual way.
The purpose of these software tools is to help a group of system designers present their ideas in a logical and meaningful way--there is no way to automatically translate the ideas into an actual program. However, this system does demonstrate the usefulness of using graphical representations to formally define what the system is meant to do. It is hard to see how the full intricacy of a large system can be expressed without recourse to some pictorial representation, either automated as in this case or simply using pencil and paper.