Next: Conclusions Up: Literature Review Previous: Gaining an Overall View Contents
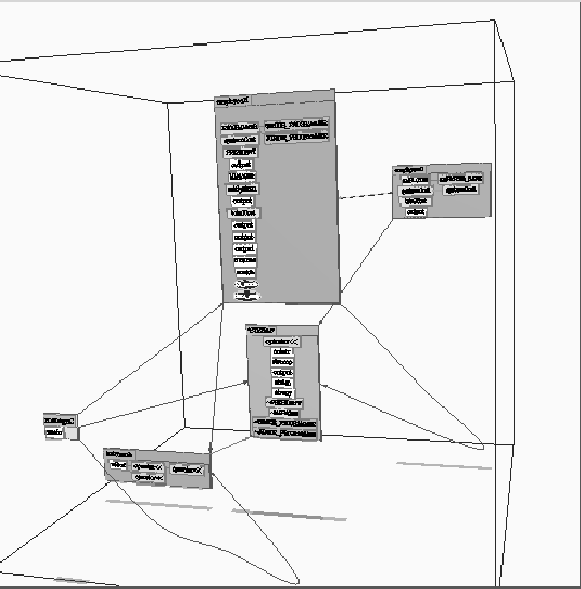
With personal computers reaching new heights of speed and capacity, 3D real time applications have received a huge boost in interest. One attempt to represent program information in a 3D system was made by Reiss [15], in a program called Plum. It provides mechanisms for displaying many different aspects of a program such as call-dependency graphs, performance statistics, and the original source code. His system uses various mechanisms to neatly display complicated structures such as trees and graphs in 3D (see Figure 2.7).
One interesting aspect of the program is the use of text. Most of the objects displayed by Plum are labelled with text, but because of the 3D rendering these labels are frequently impossible to read unless the view is zoomed in quite close. This is less of a problem than might be anticipated, because it is the picture of the program that stays in the user's mind. The text is important for gaining an initial understanding of what an object represents, but afterwards the spatial relationships themselves provide all the cues the user needs. The program is severely handicapped by the overhead of rendering the 3D data. The advantage, however, is that it creates an extremely strong pictorial impression in the mind, and depends on text to an even lesser extent than the other programs I have discussed.
Matthew Exon 2004-05-28